
Appearance
Dashboard
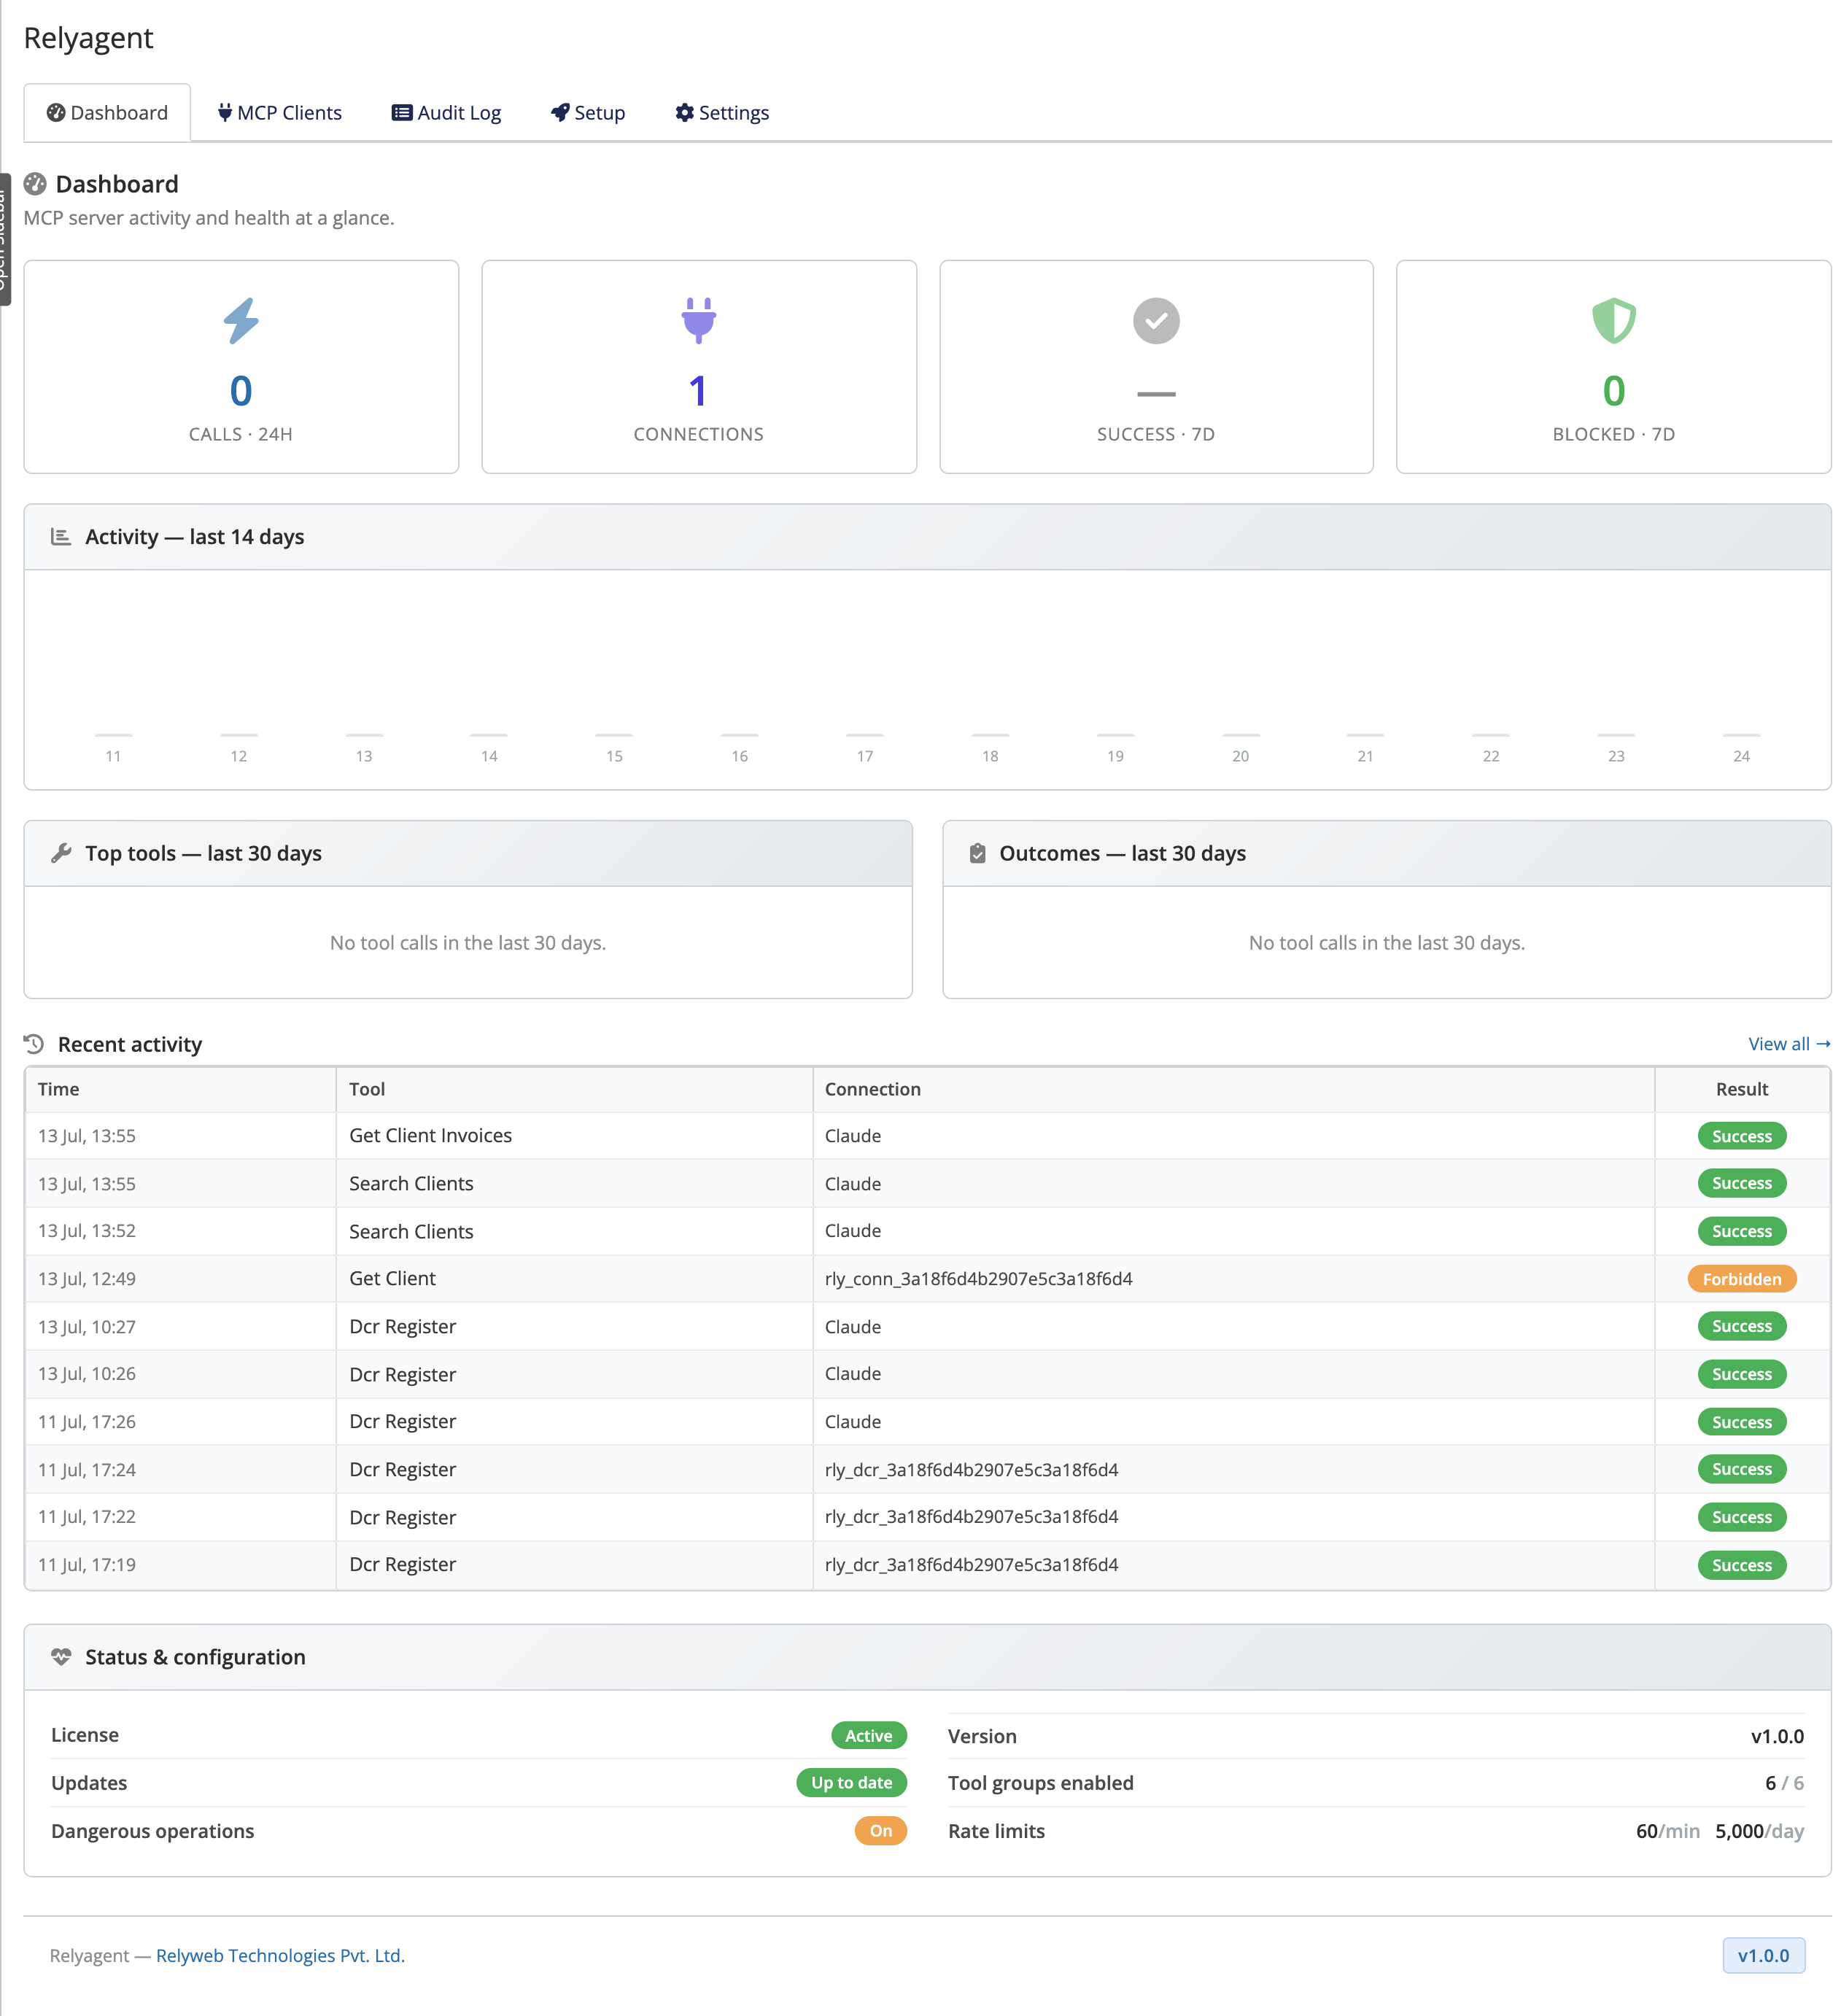
The Dashboard under Addons → Relyagent → Dashboard provides real-time visibility into Model Context Protocol (MCP) server activity and tool invocations across connected AI clients.
The Dashboard is read-only. It reports what has happened; it never changes anything. When you want to act on what you see, head to the tab that owns that action (linked throughout below).
 Addons → Relyagent → Dashboard
What you see
- KPIs: headline metrics summarizing total calls, active connections, and error rates.
- 14-day activity trend: rolling chart displaying daily invocation volume and traffic shifts.
- Top tools: frequency breakdown of the most frequently executed WHMCS tools.
- Outcome breakdown: ratio of successful calls versus blocked, sanitized, or rate-limited requests.
- Recent activity: live stream of the latest tool execution events.
Where to go to act
Because the Dashboard is a summary, you act elsewhere:
- Audit Log: view the complete, filterable record of every call under Audit Log.
- Manage connections: create or edit connection permissions under Connections & OAuth (MCP Clients tab).
- Configure caps: toggle tool groups, dangerous operations, or rate limits under Settings → MCP Settings (see MCP tools).
TIP
Seeing lots of blocked or rate-limited outcomes? That usually means a connection is missing a tool, a group is turned off, or a rate limit is too low. The Audit Log shows the exact reason per call.